Qradar101 Lab
The
Lab
provid a 19.8 GB file named CD.Qradar.ova this file is an Open Virtual Appliance, which is essentially a pre-packaged virtual machine. It contains a complete virtual environment, including an operating system, pre-installed software, and configuration settings, all bundled into a single file.
Qradar indicates that this virtual appliance is an instance of IBM QRadar, which is a SIEM platform. Using this OVA file allows us to run a fully configured QRadar environment without needing to manually install and configure the system from scratch.
Instructions
The lab also provided some instructions with instructional video make sure to watch it, to use the OVA file, it must be imported into a hypervisor, the instructional video uses VirtualBox
Open Virtulbox > File > Tools > Network, Click Create select Host-only network and set Adapter address to 192.168.20.1 like this:

Enable the DHCP Server as well and make sure it’s as shown in the instructional video like this:

After that open Virtulbox > File > Import Appliance and pick the OVA file and setup the machine as shown in the video, make sure the network adapter is set to the one we just created.

Run the machine and login with root:cyberdefenders

then wait a minute then visit: https://192.168.20.21/
It may give you a Warning: Potential Security Risk Ahead
The browser shows this warning because QRadar uses a self-signed certificate, which browsers do not trust by default, this is safe in a lab environment, just click Advanced then Accept the risk and continue to enter the IBM QRadar Dashboard.
On the IBM QRadar Dashboard, login with admin:Admin@123

When viewing logs and events in THIS lab, it is important to use the same time range shown in the lab video. If a different or more recent time range is applied, the expected logs and events may not appear, as they fall outside the specified filter window.

ok everything is ready let’s start:
Q1 How many log sources available?
In the Admin tab then Log Sources in the Data Sources section:

There are 15 log sources configured in this lab:

Each log source may represents a system, application, or device that sends security events to QRadar.
Q2 What is the IDS software used to monitor the network?
If you look at the log sources list you can see it’s Suricata, also mentioned in the challenge dataset under the scenario.
Q3 What is the domain name used in the network?
The Log Activity tab in QRadar displays all collected events from connected log sources.
On there Add Filter then filter for EventID 4624 a Windows Security Log event that records every successful logon attempt:

When you apply a filter in QRadar, you can see the Current Filters and the events table below. Make sure that your search is within the time range mentioned earlier, otherwise the expected events may not appear.

Open one of the filterd events and go to the Payload Information section, you will find the domain name: hackdefend.local

Q4 Multiple IPs were communicating with the malicious server. One of them ends with “20”. Provide the full IP.
This time remove the filters and change the Display from Default to Source IP
This will show all source IP addresses events, only one IP ended with .20 which is 192.168.20.20

Q5 What is the SID of the most frequent alert rule in the dataset?
In QRadar, every correlation or detection rule has a unique identifier called a SID (Signature ID) when QRadar detects an event that matches a rule, it generates an alert with that SID.
Now on the Log Activity tab you can apply the filter: RULE SID (custom) | is not N/A this filter means only events which matched a QRadar rule. After the filter, there were 109 total results and checking each one by one is something i’m not doing, so:
In IBM QRadar, there’s smth called Grouping By filter is used to aggregate events or flows based on a common field, i’ll use that so i don’t have to check all 109 event.
On Log Activity tab > Search > New Search

The most frequent alert rule is: 2027865

Q6 What is the attacker’s IP address?
On the Offense tab > All Offenses
you may not found any result so make sure to clear the Closed Offenses filter.
There’s only one ip that’s coming from outside the network which is: 192.20.80.25

QRadar continuously collects logs and events from different sources. On their own, these events might not mean much. However, QRadar applies correlation rules to detect patterns. When a rule is triggered in a meaningful way, QRadar groups related events together and creates an Offense to represent a potential security incident that requires investigation.
Q7 The attacker was searching for data belonging to one of the company’s projects, can you find the name of the project?
The fastest way is to search for the word project and go from there:
Go to Log Activity apply the filter: Payload Matches Regular Expression is project

Pipeline Execution Details For Command Line This event typically indicates that a command was executed using a pipeline.
Module Logging Command Invocation This event indicates that a specific module or logging component captured a command execution. It’s more about who logged it, not just the command itself
On the first event he did this:

Get-ChildItem Lists files and directories similar to ls, searching inside this folder C:\Users\nour.HACKDEFEND Looks specifically for files with this exact name: project48-transactions.xlsx
-RecurseSearches all subfolders inside that path.-ErrorAction SilentlyContinueSuppresses errors (like access denied), so they don’t clutter output.-ForceIncludes hidden and system files in the search.
you can stop here and tell that the project name is: project48 but let’s see the other events:
further analysis
Nothing much happend in the 2nd event. 3rd event ~40 seconds later he did another search:
Get-ChildItem -Path C:\Users\nour.HACKDEFEND -Filter project48 -Recurse -ErrorAction SilentlyContinue -Force
Before he did an exact file, now a broader keyword search for project48
192.168.10.15 nour, is compromised so keep that in mind.
Q8 What is the IP address of the first infected machine?
Go to Log Activity and filter by source IP of the attacker: 192.20.80.25

So the first infected was: 192.168.10.15 which is nour the compromised machine we saw earlier :)
Q9 What is the username of the infected employee using 192.168.10.15?
Go to Log Activity and filter by the infected machine source IP and there is the username nour:

Q10 Hackers do not like logging, what logging was the attacker checking to see if enabled?
Go to Log Activity and filter by the infected machine username nour
After logging into nour, the attacker used PowerShell. But… to me just using it doesn’t confirm if logging is enabled or not, idk why PowerShell is the answer to this but let’s look deeper:
further analysis
PowerShell Console Started Windows Event ID: 400
Meaning a PowerShell process has just launched on the system.
PowerShell Console Ready Windows Event ID: 403
Meaning the PowerShell process is fully initialized and ready to accept commands.

The event after the PowerShell was ready is Module Logging Command Invocation This is PowerShell Module Logging, which records commands run in PowerShell modules. Every time PowerShell runs a command or executes part of a script, it generates this type of event if Module Logging is enabled.
If we check the Payload Information:
<13>Nov 08 14:55:00 HD-FIN-03 AgentDevice=WindowsLog AgentLogFile=Microsoft-Windows-PowerShell/Operational PluginVersion=7.2.9.105 Source=Microsoft-Windows-PowerShell Computer=HD-FIN-03.hackdefend.local OriginatingComputer=192.168.10.15 User=nour Domain=HACKDEFEND EventID=4103 EventIDCode=4103 EventType=4 EventCategory=106 RecordNumber=1096 TimeGenerated=1604876097 TimeWritten=1604876097 Level=Informational Keywords=0 Task=ExecutePipeline Opcode=20 Message=CommandInvocation(Get-Process): "Get-Process" CommandInvocation(Where-Object): "Where-Object" ParameterBinding(Where-Object): name="FilterScript"; value=" $_.ProcessName -eq "Sysmon" " ParameterBinding(Where-Object): name="InputObject"; value="System.Diagnostics.Process (ApplicationFrameHost)" ParameterBinding(Where-Object): name="InputObject"; value="System.Diagnostics.Process (browser_broker)" ParameterBinding(Where-Object): name="InputObject"; value="System.Diagnostics.Process (cmd)" ParameterBinding(Where-Object): name="InputObject"; value="System.D
specifically these:
CommandInvocation(Get-Process): "Get-Process"
CommandInvocation(Where-Object): "Where-Object"
ParameterBinding(Where-Object): name="FilterScript"; value=" $_.ProcessName -eq "Sysmon" "
Multiple CommandInvocation entries in one event usually indicate a single pipeline, not separate commands, because:
Where-Object is not useful by itself, it filters input.
The ParameterBinding for FilterScript references $_ which is the pipeline object.
$_ always refers to input from the previous command in a pipeline.
So here The attacker ran a PowerShell pipeline like this:
Get-Process | Where-Object { $_.ProcessName -eq "Sysmon" }
$_.ProcessName -eq "Sysmon" Check the ProcessName of this current process object $_ sent by the previous command Get-Process and see if it equals Sysmon.
So the attacker was using PowerShell to see if monitoring/logging (Sysmon) is active.
Q11 Name of the second system the attacker targeted to cover up the employee?
Cover up? let’s search for deleted things.
Process CommandLine (custom) is a custom field that captures the full command used to run a process on a system. Filter by for del command:
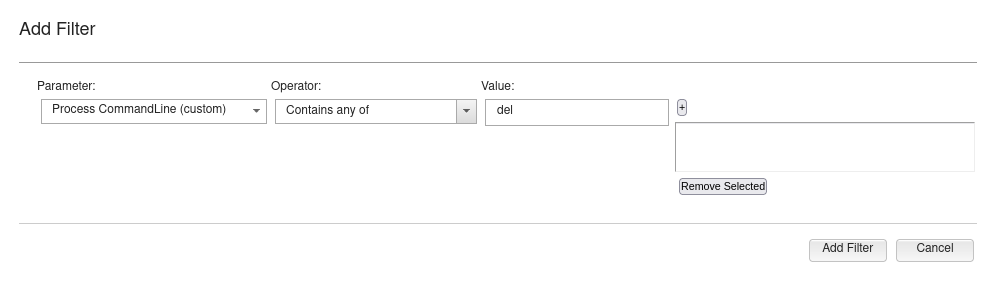

cmd.exe /Q /c del sami.xlsx 1> \\127.0.0.1\ADMIN$\__1604917981.0572538 2>&1
This is a Windows cmd.exe command that deletes a file and redirects output to a hidden administrative SMB share on the local machine.

The second system the attacker targeted to cover up the employee is mgnt-01
Q12 When was the first malicious connection to the domain controller (log start time - hh:mm:ss)?
Filter for Microsoft Sysmon Event ID 3 (Network connection detected)

The first log shows a suspicious executable C:\Users\nour.HACKDEFEND\FSETPBEUsIek.exe making an outbound TCP connection to nothing.attdns.com (192.20.80.25) on port 449
This is likely the initial malware communication or command-and-control (C2) traffic.
The second log shows C:\Windows\SysWOW64\notepad.exe connecting to the domain controller 192.168.20.20 on port 389 (LDAP)
A normal notepad.exe should not typically make LDAP connections, which suggests:
The first malicious connection to the domain controller occurred at:
11:14:10
Q13 What is the md5 hash of the malicious file?
Filter by Payload Contains is md5


important_instructions.docx is the malicious file with hash:
MD5=9D08221599FCD9D35D11F9CBD6A0DEA3
Q14 What is the MITRE persistence technique ID used by the attacker?
Persistence: The adversary is trying to maintain their foothold. ID: TA0003
Sysmon Event ID 13 specifically identifies when a Windows Registry value is created or modified:
after going through them:

The attacker created a Run key persistence entry: ...\CurrentVersion\Run executes script .vbs file in TEMP at logon
This means the technique T1547.001 (MITRE ATT&CK: Registry Run Keys / Startup Folder) describes a persistence technique used by adversaries to ensure malicious code executes automatically when a system starts or a user logs in. It is a sub-technique under the broader tactic of Boot or Logon Autostart Execution.
Q15 What protocol is used to perform host discovery?
ICMP like cmon what other host discovery protocol is 4 letters? ARP? :P
Q16 What is the email service used by the company?(one word)
By excluding internal network traffic and focusing on external DNS resolution, several MX record lookups were observed pointing to Microsoft.
To validate ownership, filter DNS traffic and check the resolved IP addresses using an external IP geolocation or lookup tool. That the mail service from Microsoft office365.
Q17 What is the name of the malicious file used for the initial infection?
Saw that earlier in Q13 when we were looking for the md5 hash it was important_instructions.docx

Q18 What is the name of the new account added by the attacker?
Windows Event ID 4720 is a Windows Security log event generated whenever a new user account is successfully created


The new account is rambo
Q19 What is the PID of the process that performed injection?
Sysmon Event ID 8 (CreateRemoteThread), which tracks when a process creates a thread in another process—a technique frequently used by malware for code injection.


7384
Q20 What is the name of the tool used for lateral movement?
We need to fo some filters:

you will find a registry modifications under: Software\Policies\Microsoft\Windows\PowerShell
This activity is commonly associated with enabling or modifying PowerShell execution behavior, which is often leveraged by attackers to facilitate remote command execution during lateral movement.
To determine the tool used, the activity was correlated with MITRE ATT&CK techniques related to lateral movement, particularly those involving remote Windows administration mechanisms such as WMI.
Further analysis of common adversary toolsets used for Windows lateral movement indicated that the behavior matches tools from the Impacket framework, which is widely used for remote execution in Active Directory environments.
Among Impacket tools, wmiexec.py is specifically designed to execute commands remotely via Windows Management Instrumentation (WMI), making it a common choice for lateral movement in compromised networks.
Therefore, the tool used for lateral movement is wmiexec.py
Q21 Attacker exfiltrated one file, what is the name of the tool used for exfiltration?
I honestly just assumed curl
Q22 Who is the other legitimate domain admin other than the administrator?
Windows Event ID 4672 signifies that an account with administrative or special privileges has successfully logged on.
Filter by that and group by Username:

It’s Adam
Q23 The attacker used the host discovery technique to know how many hosts available in a certain network, what is the network the hacker scanned from the host IP 1 to 30?
Filter Zeek network connection logs to identify host discovery activity performed by the attacker.

The logs show the attacker performing a systematic scan across IP range 192.168.20.1 to 192.168.20.30 with short time range.
Based on the observed IP range, the scanned network corresponds to 192.168.20.0
Q24 What is the name of the employee who hired the attacker?
on Q11 we name the second system the attacker targeted to cover up the employee, and he deleted this file:
cmd.exe /Q /c del sami.xlsx 1> \\127.0.0.1\ADMIN$\__1604917981.0572538 2>&1
The employee name is on the deleted file, which is sami